Evolution of traffic over the years
Average traffic on BNIX has quadrupled in 7 years

Due to the strong rise of mobile internet, e-commerce, cloud services and the Internet of Things.
Data traffic in 2020

In the corona year 2020, traffic increased by 37.5%.
Data volume 2020

The Belgian Internet node processed 869 616 000 GB of data in 2020.
The BNIX platform
Participants

76 companies and organizations are connected to the BNIX platform.
Datacenters

The BNIX infrastructure is spread over 3 locations in and around Brussels.
Active connections: number and types
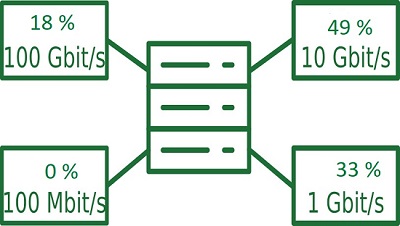
Almost half of the connections are 10 Gbit/s connections.
Infrastructure

13.2 Tbps It is the capacity of the switches. They are 4x more powerful than the previous ones.
Peaks and lows in 2020
Top months

Most traffic was exchanged during the first and second lockdown. On Tuesday 15 December 2020, traffic on BNIX exceeded the cape of 600 gigabit per second.
Peak moments

The peaks on the BNIX platform in 2020 mainly occurred in the afternoon instead of the evening, especially because of many people working from home.
Off-peak moments

Trafic decreased on Saturdays and Sundays.